Thursday, November 27, 2008

gbp and cad trades


Sentiment has changed a bit for the dollar. Whether its end of the year squaring (deal desks are thin) or traders are less risk averse, I noticed that the dollar was giving up its gains i.e. higher highs and higher lows on gbp, euro, etc. And as usual, I waited for a pullback before entering on a long gbp/usd. I chose to enter on a retest of recent highs as opposed to waiting for a deeper retrace (fpp). It did pay and thats the point, to make money! On the usd/cad I scored a few points off of that, but the usd/chf did not follow suit. The pullback was too far and took out my stop before moving off of my level

Wednesday, November 19, 2008

eur/usd 60m long 1.2512

I stuck with a level that I speculated price would breach. I noticed another level that was deeper, of course hindsight is always 20/20 and I would have gotten a better fill. Oh well, I am up a few pips right now. Looks like I am on target to hit p/t.
update... booked 25 pips. very dollar bullish. pattern took a long time to develop, that tells me that there may be another leg down.


Tuesday, November 18, 2008

s/r and trendline cluster


Nice little cluster of s/r and a trendline. I had no intention of trading this because for me I need more of an argument. From my testing, setups where I wait for obvious fpp's have paid consistently and extremely quick. The candles usually "explode" off of these levels. Maybe in the future I will build the confidence to trade clusters like this, but for right now I'll just pass on it.

Monday, November 17, 2008

eur/usd 60 min short


Just another euro short that paid 60 pips. Found nice FPP resistance at 1.2722. Price hit me while I was asleep. Target was back inside of the range. As am writing this post the pair has dropped +120 pips from entry. I did not enter with my "runner", but it's not a big deal. Since my understanding of FPP, my levels for s/r has been incredible. My backtesting has also been stellar. My levels most of the time will have a less than 10 pip drawdown. Awesome.....

Saturday, November 15, 2008

eur/usd short at 1.2505

Here is a short I made on the euro at 1.2505. Pretty self explanatory but as you can see I have completely weened myself off of all indicators. Support and resistance is my bread and butter and I just want to focus on that. Although I spotted more trades this week, for whatever reason I did not take it. I have been really backtesting my s/r trades and after a little adjustments to how I cherry pick my s/r levels (thanks to my friend Steve W.), my trading and confidence has taken off. My focus is now on s/r, but more specifically areas that I am tentatively calling a Fractal Price Pivot or FPP. Simply put, it's an area where price tugs and pulls at, usually within a fractal. Another trade I am also tentatively calling an Apex Trade. This is exactly what it sounds like, I look for major areas where price pivoted and as price approaches the apex of the pivot, price will usually bounce at these levels. Many time it's where complete reversals occur. I am still utilizing fibs, weekly pivots, and chart patterns, but I will use it when there is a confluence with major s/r area, FPP, or apex. I'll include several other snapshots.

Saturday, October 4, 2008

aud/usd daily - slingshots can be found on every time frame


Just wanted to make another submission. I see slingshots occur on every timeframe including the daily. Targets and stops still apply the same way. I haven't really talked about stops. It's really subjective, I place my stops above or below the pivot swing (i.e. retracement). Enjoy!!!

nzd/usd 60 min short

I have been extremely busy over the last several weeks as you can see from a lack of posts. My only trade that I took this week was a short on the NZD/USD 60 minute chart. It was a slingshot trade that I waited for. As you can see momentum was weighted towards the downside with a close below .6670 area and weekly pivot. The pair then retested the area and gave me my slingshot trade. Slingshot trades occur when a confluence of s/r, fibs, pivots, etc. cluster together. A confluence of events (COE) if you will. As you can see from my entry, price came back to retest an established cluster zone. A bearish candle printed and as you can see from my momentum indicator was "cheering" the trade on. Some people like to call it confirmation, but how many things need to line up before you press the darn button? LOL!!!! I have included another trade for your viewing pleasure. Unfortunately I missed this one. Ugghh!!!!!

Sunday, September 7, 2008

NZD/USD 9-8-08

NZD/USD short. Sentiment was dollar positive and a nice slingshot trade presented itself. I needed to be greedy with this trade. I have a clear understanding of s/r and when I saw that the base of the fractal lined up with the .618 target as opposed to .786 target, I opted to cash in on the .618 target. Thank goodness I did. The pair never made it to the .786 then blasted off in the other direction.

Saturday, August 30, 2008

Trading Rules


My trading rules are an amalgamation of several professional traders - Chris Lori, Rob Booker, and Mark 
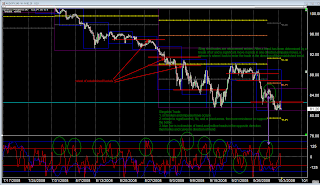
Braun. Support and resistance (s/r) is the cornerstone of my trading. Or more specifically, s/r that is determined by price. Fibonacci (fibs) and Weekly Pivot Points are also used as s/r, but they are secondary to price. My focus is trading on a retest of a determined s/r area and NEVER the break out. I enter a trade when most traders would feel the most uncomfortable, right into a bold faced candle moving in the opposite direction. Most of the time price consolidates then breaks out, moves to another area, then consolidates. In the past, when I traded the breaks, once price broke out and closed beyond an established s/r area, I would enter a trade and get stopped out or my stop loss would be to great to justify my entry. Once I learned that price spends most of the time consolidating I started trading retracements, either at a major price s/r level or an area where different levels of s/r occurs (i.e fib, pivot, and s/r clusters) which I call the "Slingshot Strategy". This is just a "simple" explanation of my trading rules. I can not possibly explain every nuance here. It will come with every chart I post. So thank you for reading this, good luck with your trading and be careful out there.